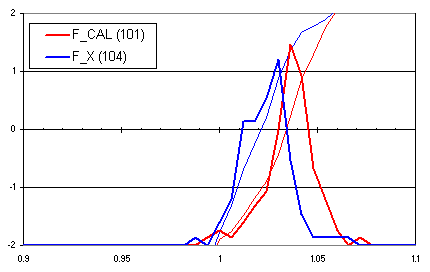
GT (37ºC)
CAL target
Source: Nordic Trueness Project 2002
| Material | Nordic Trueness Project 2002 | Reference method, DGKC 1997 | NORIP | |||||
MEP17-1 transferred value |
Standard uncertainty |
Median | Value | Standard uncertainty | Mean | s | N | |
CAL |
35.8 | 1.35% | 35.9 | |||||
X |
35.4 | 1.35% | ||||||
Distribution of factors CAL/IMEP17-1 and X/IMEP17-1

CAL-corrected mean of control values X, P, HIGH (H), LOW(L)
For each method group all corrected values outside method group mean + 2s are discarded before calculation
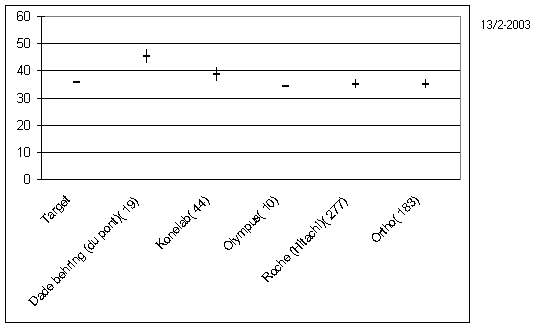
Instrument comparisons of mean and standard deviation of CAL
Only CAL values from laboratories with IFCC compatible methods
Y-axis: Concentration/activity. X-axis: Instrument producer (number of cal values in brackets)
Plot: Mean of CAL + 1 standard deviation
Laboratorys mean of CAL relative to "minimum" bias goals...
...expressed as Target value x (1 + 0.375 x CVb) where CVb is total biological variation expressed as a coeffisient of variation (43%)
Method specific %CV (all control values), mean, maximum and minimum (no of labs in brackets on X-axis)

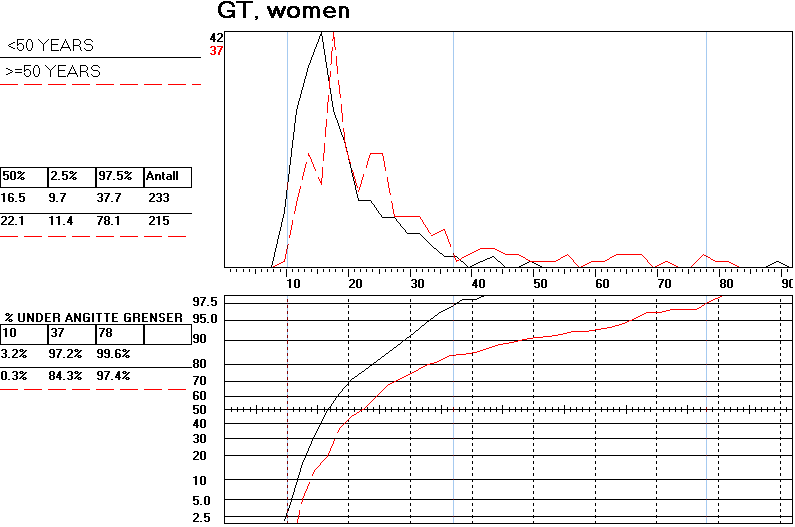
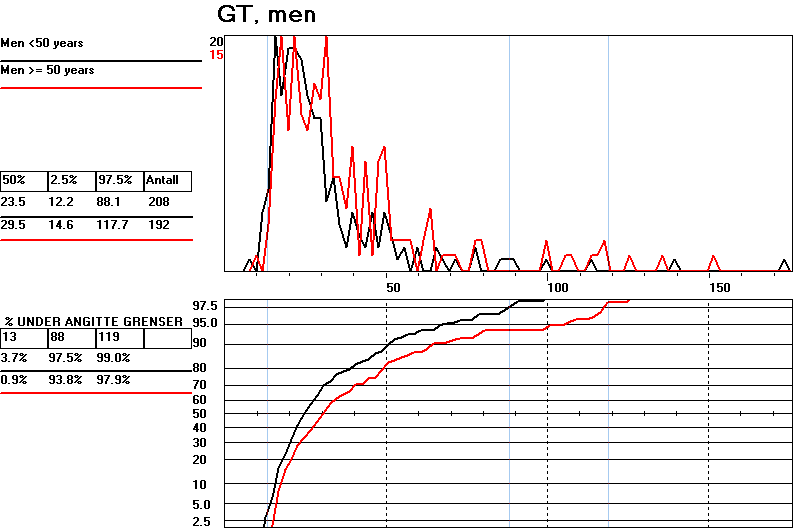
Distributions for different method types (both gender)
First corrected for slope/intercept submitted by lab, then corrected by using CAL-target (36.3 U/L)
Number of results and ref.interval in brackets behind description of each distribution

Distributions of reference values according to proposed partitioning criteria for IFCC compatible methods (not CAL-corrected)
Raw data, female <50, female >=50, male <50, male >=50
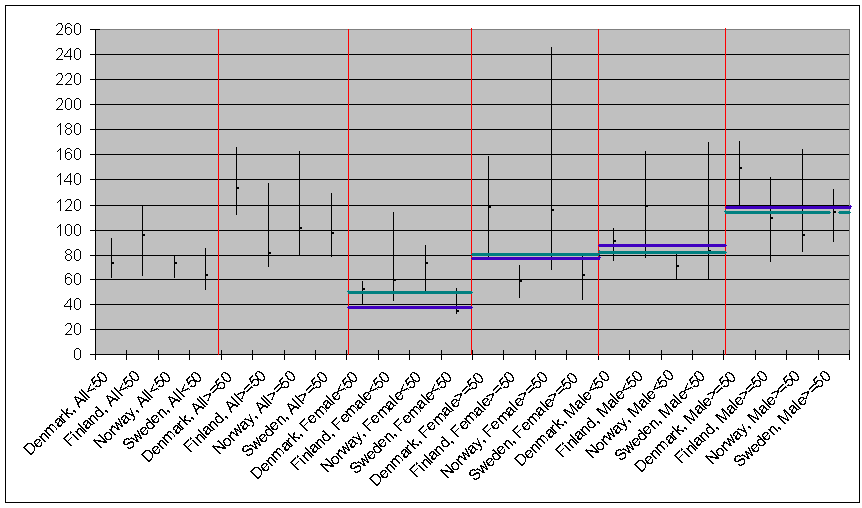
Upper reference limit for all countries, female and male, <50 years and >=50 years with 90 % confidence limits, all methods used
The data basis for the table and graf are CAL- and intercept/slope-corrected GT reference values for all methods. As can be seen from the graf under the headline "Distributions for different method types (both gender)" above, the CAL-corrected distributions are nearly identical for high values and should indicate that all metods can be used for evaluation purposes.

The horisontal thick blue and green lines are calculated upper reference limit, green based on these data (CAL- and intercept/slope correceted, all methods) and blue for the selected IFCC methods, not CAL-corrected. The limits are nearly identical except for female < 50 years.
Comments:
For Finland and Sweden the limit for female >=50 years are low and comparable with < 50 year.
The limits for female >=50 years for Denmark and Norway are high and comparable with limits for men >= 50 years.
Greatest national differences for females >=50 years.
Finnish males <50 years have high reference limit, identical with limit for males >=50 years.
Age related reference intervals
Vitros (Ortho) results included
Values for female >124 and for male >217 are excluded (>4s, log-transformed)
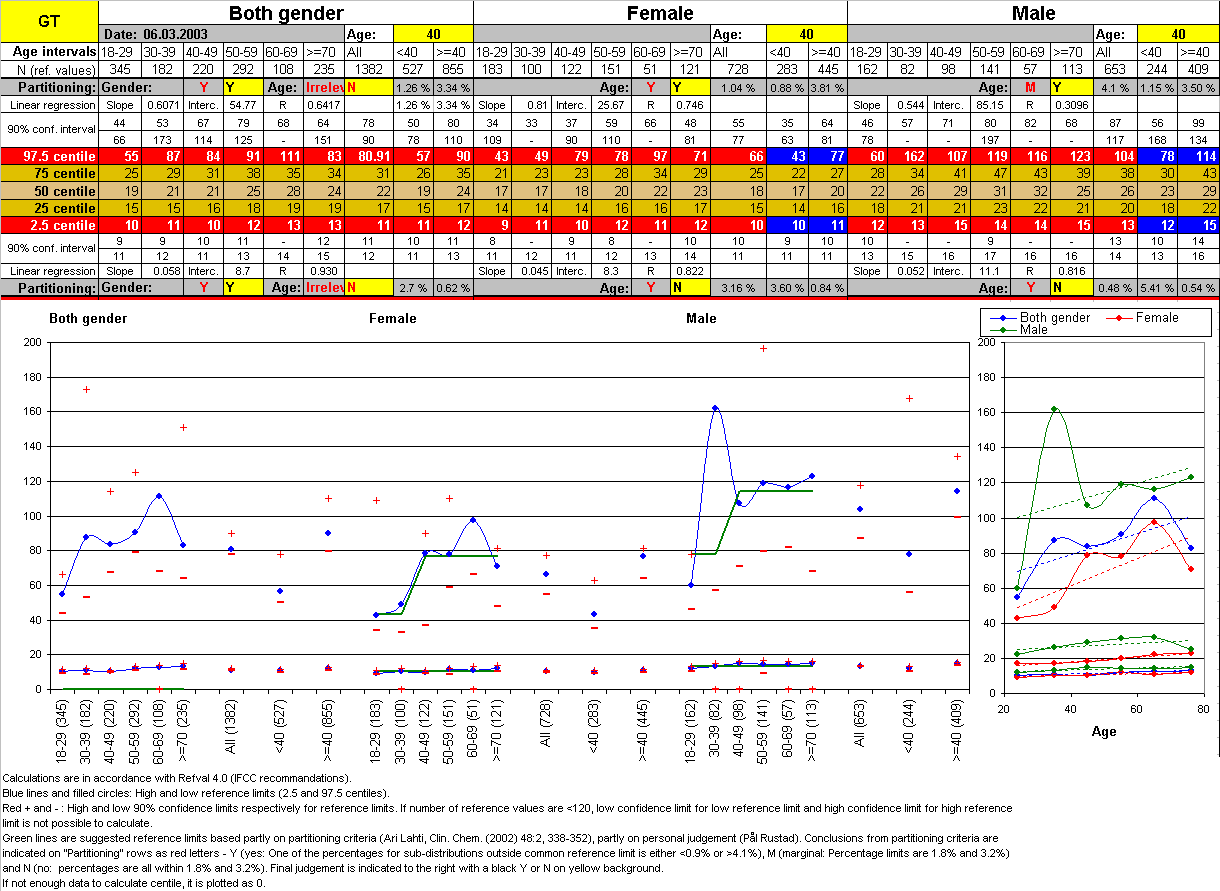
Comments: See effect of medication and alcohol on reference intervals for ALT an GT
Age dependence for each country
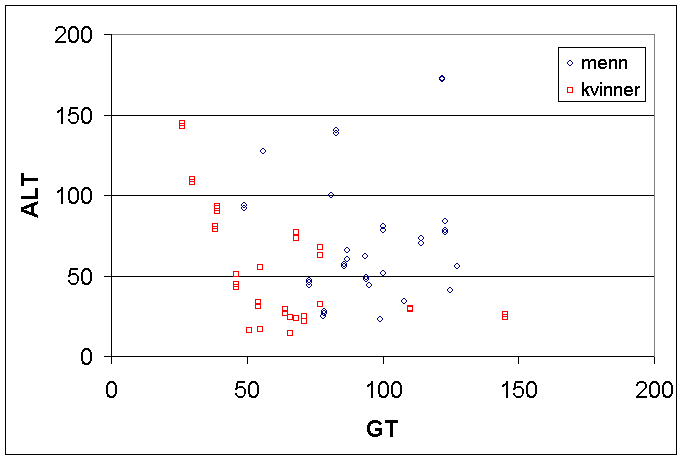
Relationship between GT and ALT for those persons with either high GT or high ALT.
Reference values and - limits (y-axis) against age (x-axis)
The rounded reference limits (red) are proposed by the norwegian enzyme group (see report)

Country differences
Country mean for Hitachi/Modular instruments
Deviation from all mean ± error (2s/n½ where s is standard deviation and n is number of data for each country).

Country reference limits with 90% confidence interval
Partitioning is indicated in the grey rows as Y (yes: <0.9% or >4.1% of subpopulation outside common reference limit), M (moderate: % outside is either in the interval [0.9%,1.8%] or [3.2%, 4.1%]), N (no: % outide is in the interval [1.8%, 3.2%]) as evaluated accoding to Ari Lahti's recommandations (but so far not taken into account).
The conclusions (N, M or Y) for partitioning (grey rows) for "Sum", "F", "M" for each country is relative to respective columns in "All".

Mean of thawed serum reference values (person results) for each laboratory and instrument producer.
For enzymes, data for both controls and reference values are first recalculated back to original instrument data using slope and intercept reported by each laboratory.
Black points - not corrected by laboratory mean of CAL or X.
Red points - corrected by laboratory mean of CAL or X.

Comments: None.
Maximum, mean and minimum of all reported reference values (person results) for each laboratory sorted on mean.
Correlation with Body Mass Index (weight/height²)
Only plotted data that are used for reference interval calculation.
Women
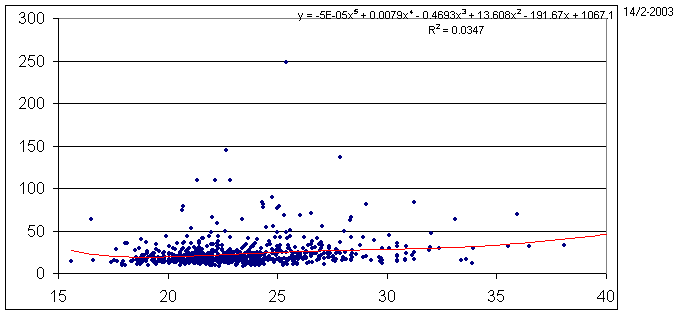
Men
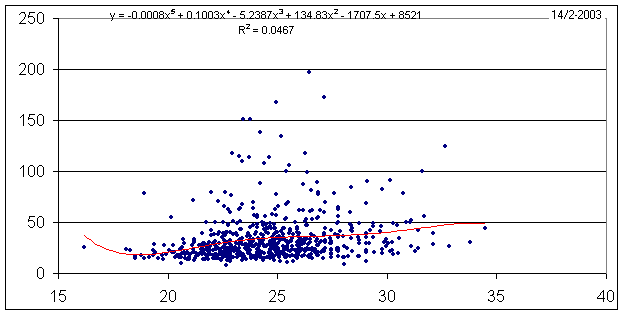
Comparison Vitros 950 (Ortho)/Hitachi 917 (Roche), thawed serum for one laboratory

Comparisons thawed serum (x)/fresh plasma (y) (regression plot) stpf
Only data for calculating reference intervals used .
Regression model: Passing and Babloc
Software: Analyse-It
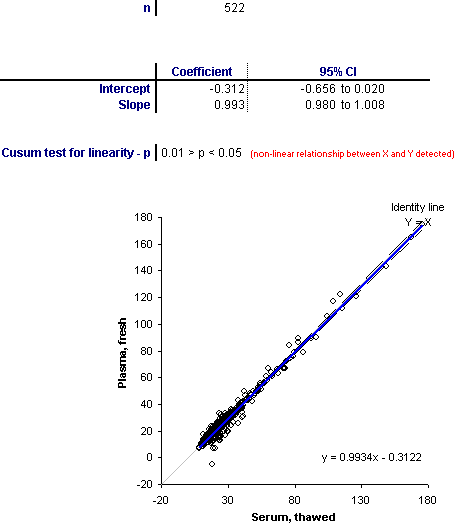
Comments: None
Comparisons fresh serum/thawed serum (regression plot) stsf
Only data for calculating reference intervals used .
Regression model: Passing and Babloc
Software: Analyse-It

Comments:
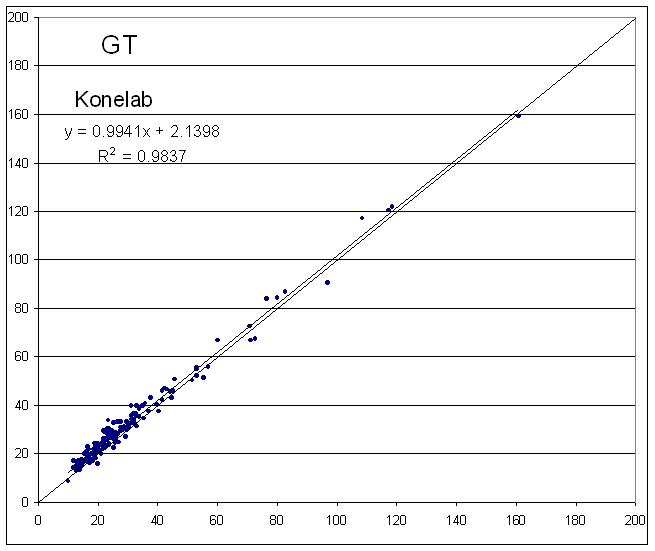
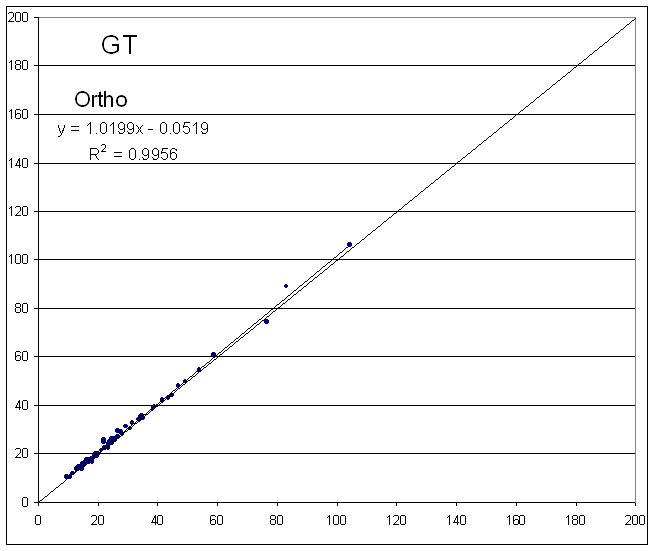
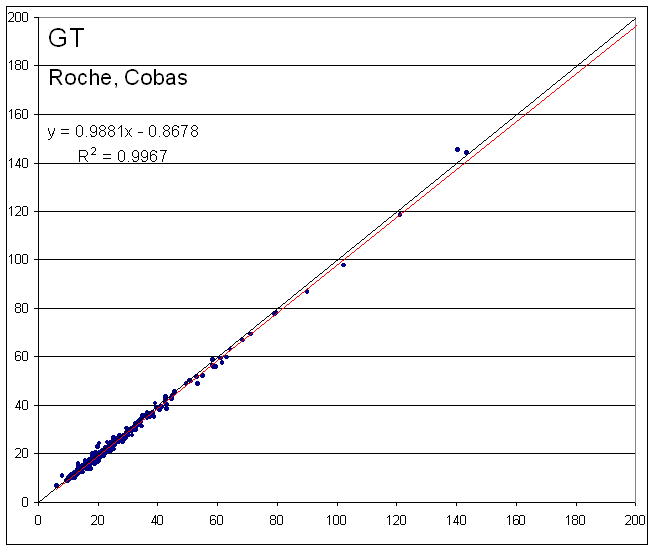
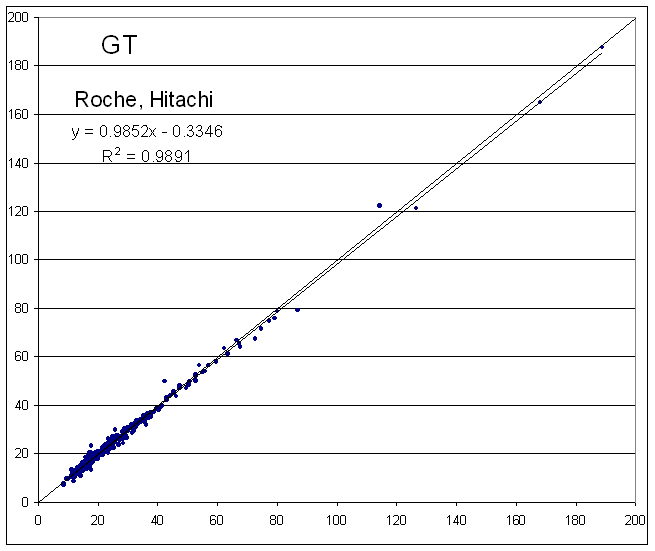
Instrument comparisons thawed serum (x)/fresh plasma (y) korr_sp
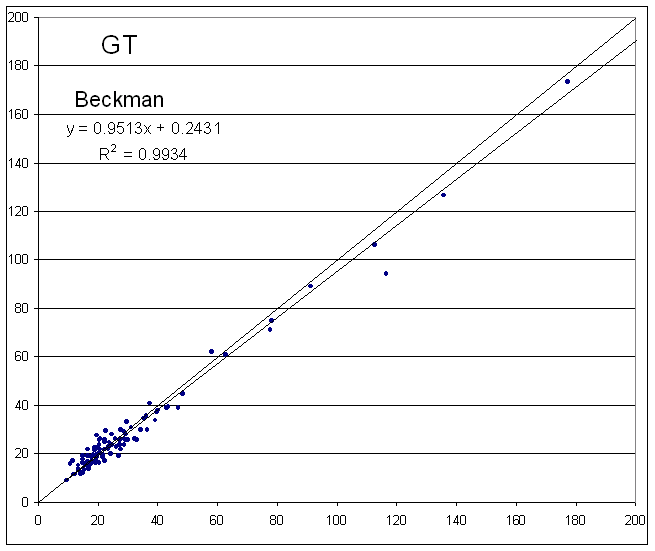
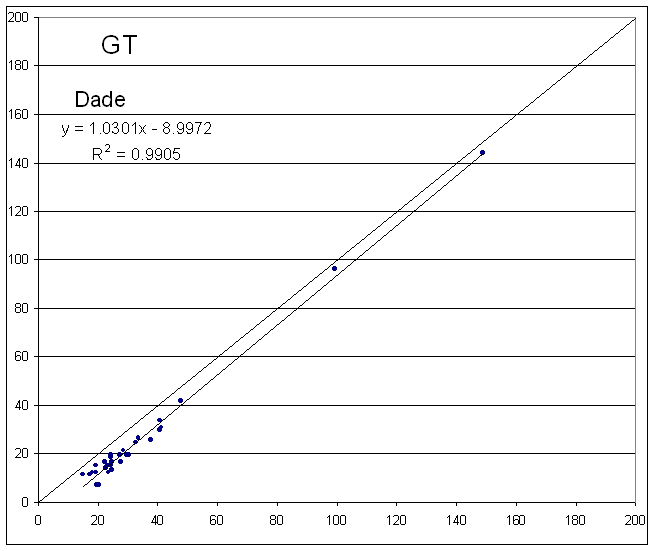
Comments: None