Iron saturation
Instrument comparisons of mean and standard deviation of CAL stpf_i
Y-axis: Deviation from CAL-target. X-axis: Number of cal values in brackets
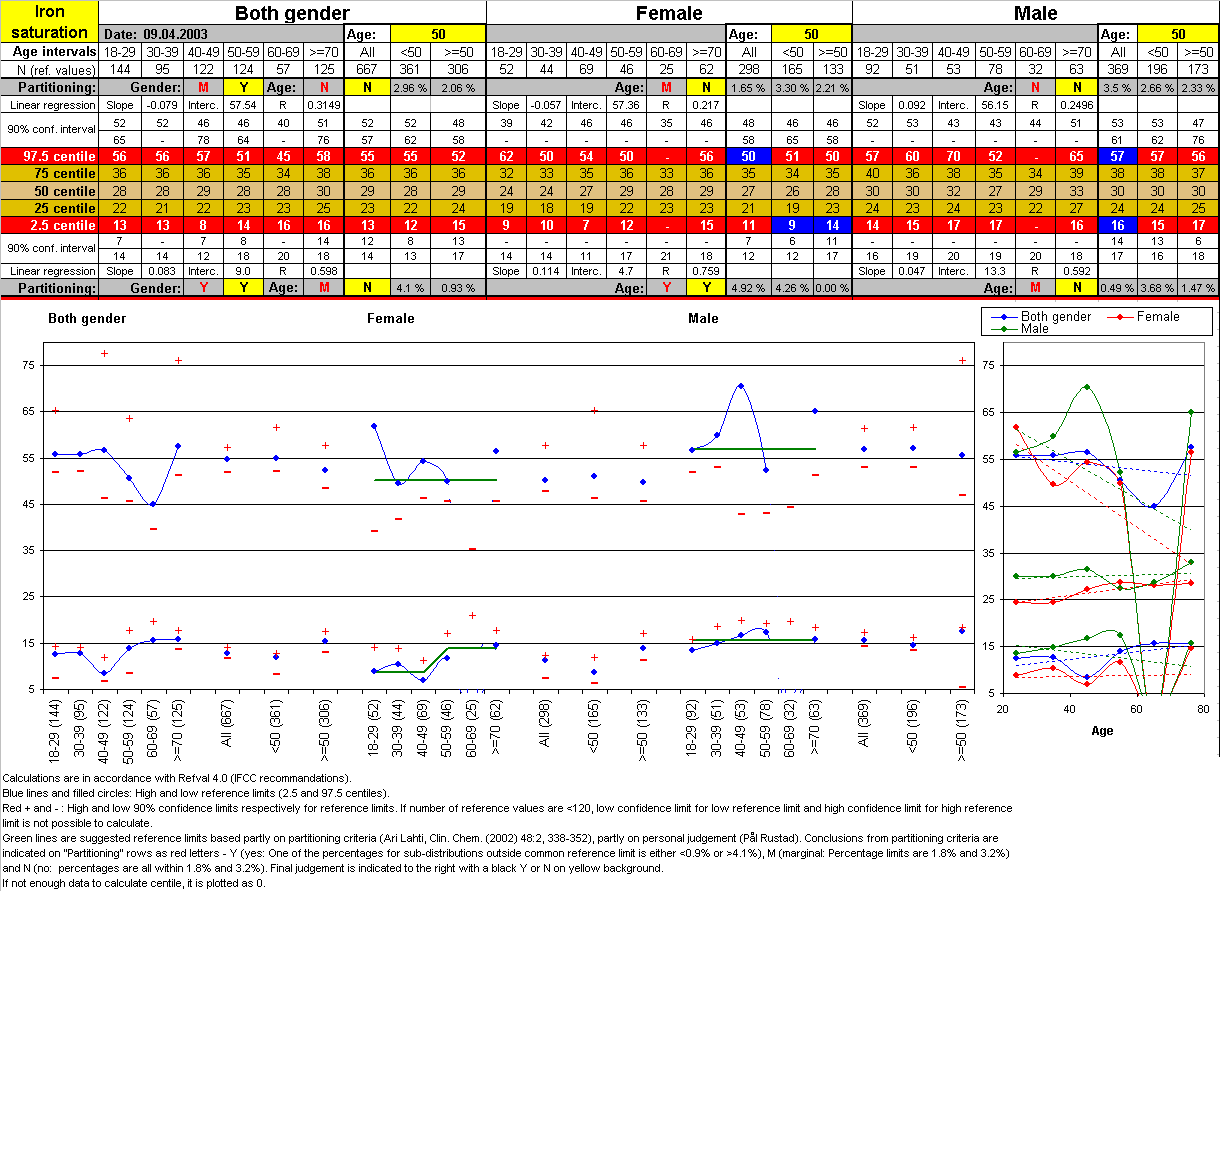
Age related reference intervals (fraction instead of %)

Reference values and - limits (y-axis) against age (x-axis)
Reference limits (red) as proposed by NORIP (see here)

Country reference limits with 90% confidence interval.
Partitioning is indicated in the grey rows as Y (yes: <0.9% or >4.1% of subpopulation outside common reference limit), M (moderate: % outside is either in the interval [0.9%,1.8%] or [3.2%, 4.1%]), N (no: % outide is in the interval [1.8%, 3.2%]) as evaluated accoding to Ari Lahti's recommandations (but so far not taken into account).
The conclusions (N, M or Y) for partitioning (grey rows) for "Sum", "F", "M" for each country is relative to respective columns in "All".
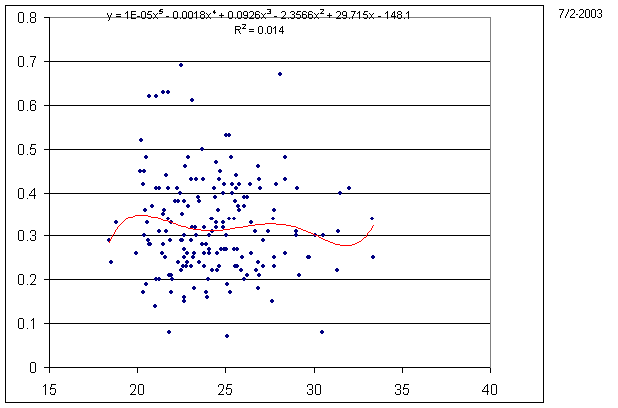
Correlation with Body Mass Index (weight/height˛)
(selected data for calculation of reference intervals)

Comparisons thawed serum (x)/fresh plasma (y) (regression plot) stpf
Comments: None
Comparisons fresh serum/thawed serum (regression plot) stsf
Comments:
Instrument comparisons thawed serum (x)/fresh plasma (y) korr_sp
Comments: None