Ferritin
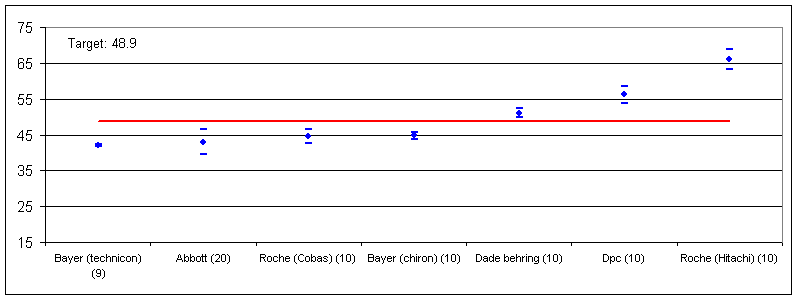
CAL target
Source: NORIP mean
| Material | Nordic Trueness Project 2002 | Reference method, DGKC 1997 | NORIP | |||||
MEP17-1 transferred value |
Standard uncertainty |
Median | Value | Standard uncertainty | Mean | s/mean | N | |
CAL |
48.9 | 17% | 8 | |||||
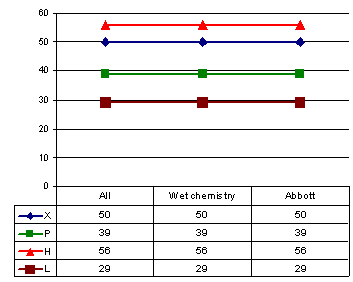
X |
||||||||
CAL-corrected mean of control values X, P, HIGH (H), LOW(L)
For each method group all corrected values outside method group mean + 2s are discarded before calculation
Instrument comparisons of mean and standard deviation of CAL stpf_i
Y-axis: Deviation from CAL-target. X-axis: Number of cal values in brackets
None
Age related reference intervals
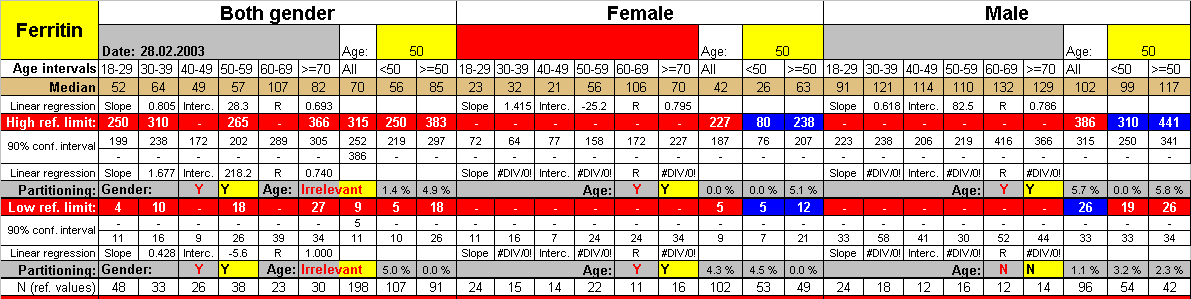
Reference values and - limits (y-axis) against age (x-axis)
Reference limits (red) as proposed by NORIP (see here)
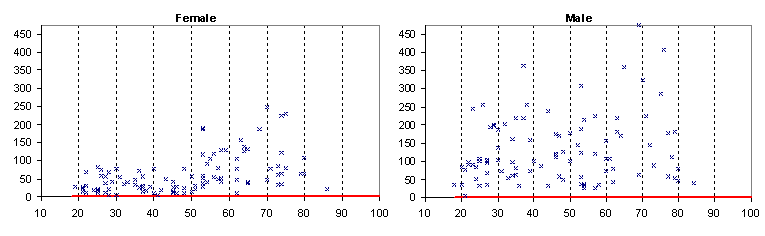
Correlation with Body Mass Index (weight/height²)
(selected data for calculation of reference intervals)
Comparisons thawed serum (x)/fresh plasma (y) (regression plot) stpf
Comments: None
Comparisons fresh serum/thawed serum (regression plot) stsf
None
Comments:
Instrument comparisons thawed serum (x)/fresh plasma (y) korr_sp
None
Comments: None