Creatinin
CAL target
Source: Nordic Trueness Project 2002
| Material | Nordic Trueness Project 2002 | Reference method, DGKC 1997 | NORIP | |||||
MEP17-1 transferred value |
Standard uncertainty |
Median | Value | Standard uncertainty/value | Mean | s/mean | N | |
CAL |
70.6 | 0.41% | 69.6 | 0.75% | 80.78 | 8.3% | 1064 | |
X |
73.9 | 0.40% | ||||||
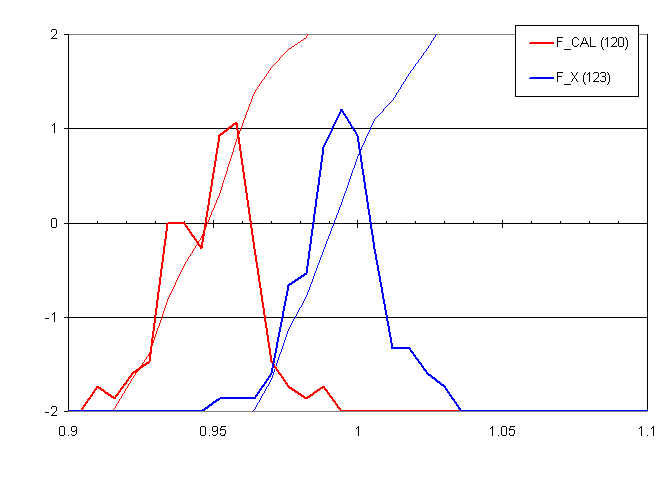
Distribution of factors CAL/IMEP17-1 and X/IMEP17-1

Laboratory means of controls
The mean of control values for each lab are first sorted on method group (or for some components on instrument producer) and then on mean value for CAL. Therefore you will see the black line (CAL) as a smooth increasing line with an abrupt decrease for each method group. The other lines are of course not so smooth. MLH is the mean of HIGH and LOW controls.
Notice that for some components MLH for Vitros is lower than for the other metod groups because Vitros have problems with diluted material (not with the concentrated HIGH!).
If a line goes lower than the Y-scale, it means that that the laboratory has not measured the respective control (for MLH: HIGH and/or LOW is not measured).
CAL-corrected mean of control values X, P, HIGH (H), LOW(L)
For each method group all corrected values outside method group mean + 2s are discarded before calculation
Instrument comparisons of mean and standard deviation of CAL stpf_i
Y-axis: Deviation from CAL-target. X-axis: Number of cal values in brackets
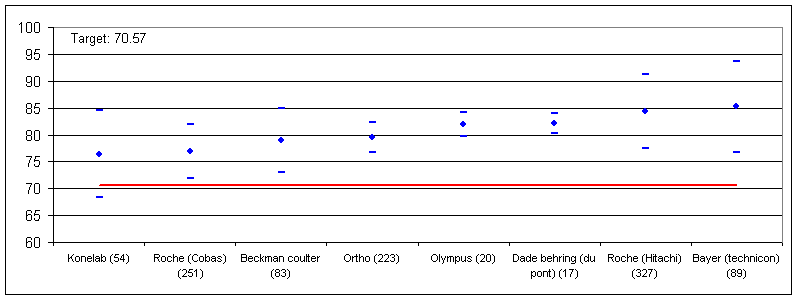
Statistics for intercept/slope-corrected CAL for the method groups
Mean an s calculated on all single results (i.e. there are 721 CAL values for Photometry, Jaffe)
Method group |
Mean |
s |
Min |
Max |
N |
! See comment |
84.8 |
1.9 |
82 |
88 |
10 |
Photometry, Jaffe |
82.3 |
7.0 |
60 |
111 |
721 |
Photometry, enzymatic |
71.3 |
5.7 |
61 |
85 |
110 |
Vitros 250-950 |
79.6 |
2.7 |
74 |
88 |
223 |
Laboratorys mean of CAL relative to "minimum" bias goals...
...expressed as Target value x (1 + 0.375 x CVb) where CVb is total biological variation expressed as a coeffisient of variation (13.6%)
Method specific %CV (all control values), median, maximum and minimum (no of labs in brackets on X-axis)
Distributions, Roche (Cobas and Hitachi)
Red-women or all
Blue-men
Distributions of reference values for the three method groups
Reference limits at z-score equal to -2 and +2
Number of reference values in brackets
12/5-2003
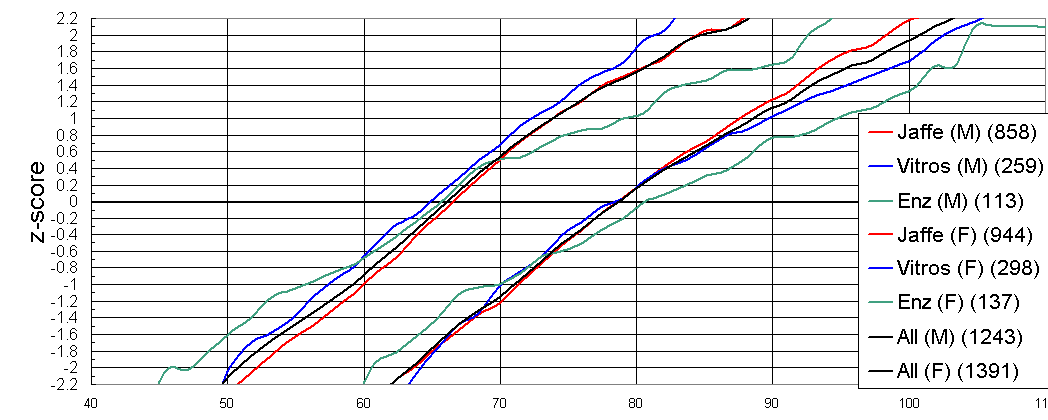
Cumulative distributions of reference values
Before and after correction with CAL (updated 2004.02.10)

Main instrument manufacturers
Updated 2004.02.09
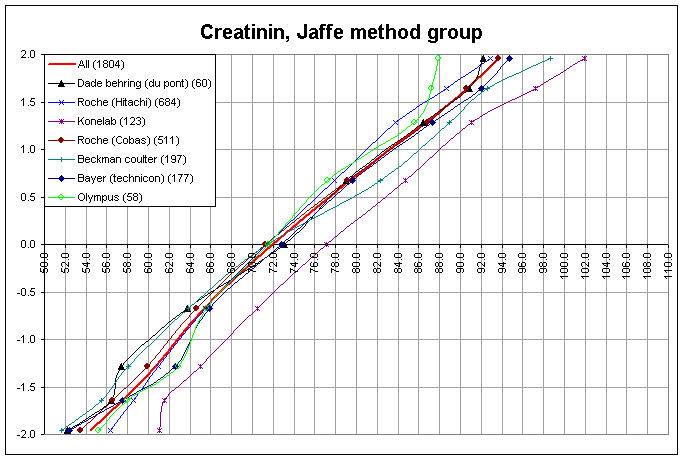
Y-axis: z-score (or standard deviate; i.e. -1.96 represent 2.5% of distribution, 0 represent 50% or median and 1.96 represent 97.5% of distribution)
Number of reference values in distribution is shown in brackets in explanation box (both enzyme and non-enzyme methods).
Jaffé method group
Updated 19/2-2004
Same plot as above, but now only for Jaffé method group
Age related reference intervals

Reference values and - limits (y-axis) against age (x-axis)
Reference limits (red) as proposed by NORIP (see here)

Country differences
Country mean for Hitachi/Modular instruments
Deviation from all mean ± error (2s/n½ where s is standard deviation and n is number of data for each country).

Country reference limits with 90% confidence interval
Partitioning is indicated in the grey rows as Y (yes: <0.9% or >4.1% of subpopulation outside common reference limit), M (moderate: % outside is either in the interval [0.9%,1.8%] or [3.2%, 4.1%]), N (no: % outide is in the interval [1.8%, 3.2%]) as evaluated accoding to Ari Lahti's recommandations (but so far not taken into account).
The conclusions (N, M or Y) for partitioning (grey rows) for "Sum", "F", "M" for each country is relative to respective columns in "All".
Mean of thawed serum reference values (person results) for each laboratory and instrument producer.
Black points - not corrected by laboratory mean of CAL or X.
Red points - corrected by laboratory mean of CAL or X.

Maximum, mean and minimum of all reported reference values (person results) for each laboratory sorted on mean.
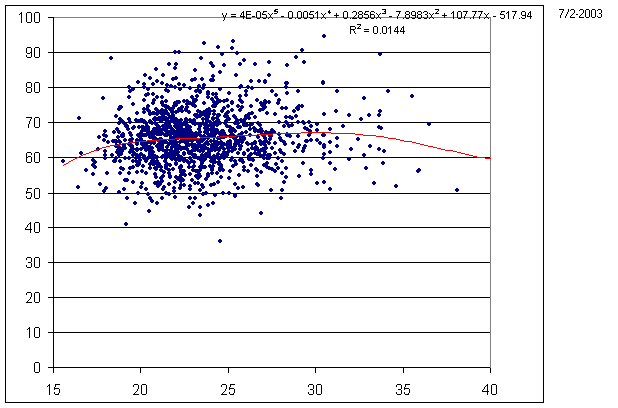
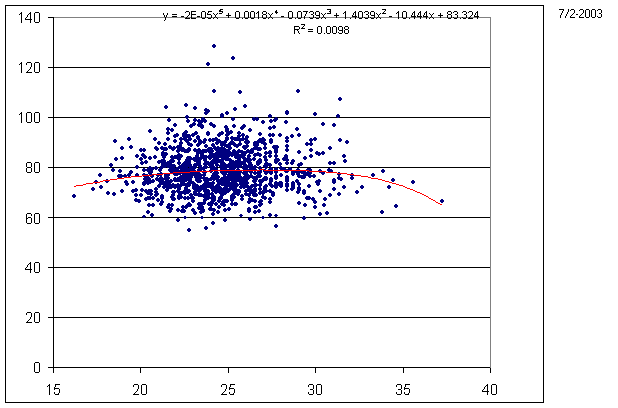
Correlation with Body Mass Index (weight/height²)
(selected data for calculation of reference intervals)
Women
Men
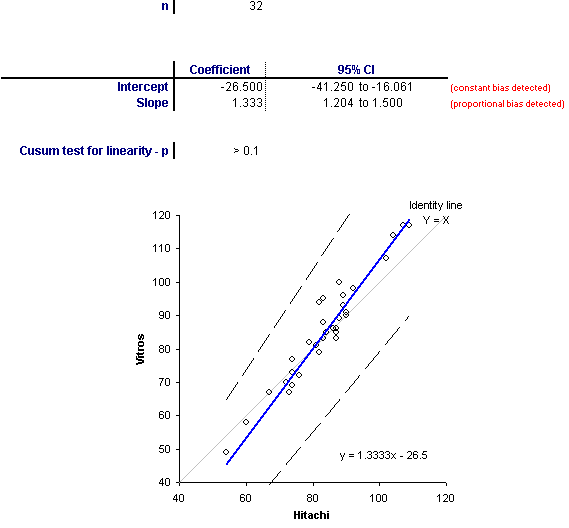
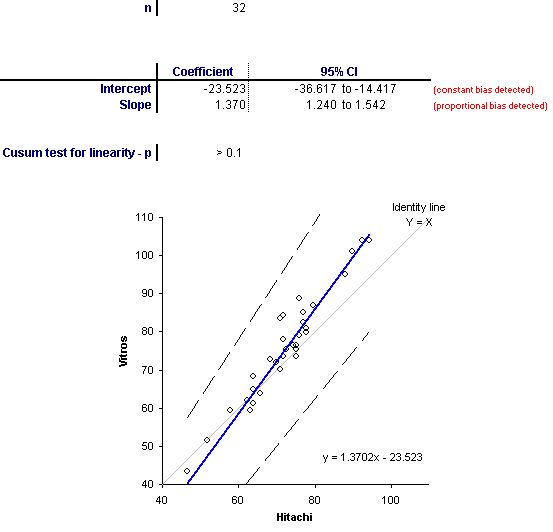
Comparison Vitros 950 (Ortho)/Hitachi 917 (Roche), thawed serum for one laboratory
Made by Analyse-It software, Passing & Bablok method comparison
X: Hitachi is not compensated Jaffé method.
Y: Vitros is enzymatic method factor-corrected by manufacturer to Jaffé level.
1. plot: Not CAL-corrected data
2. plot: CAL-corrected data
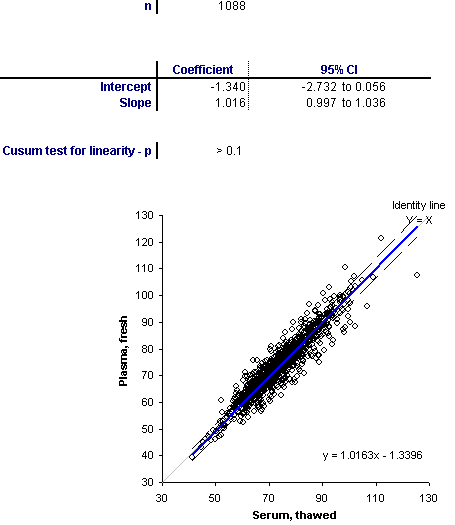
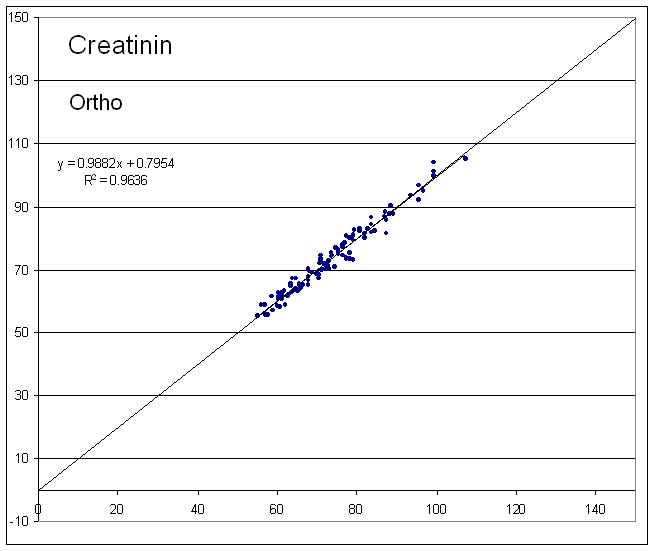
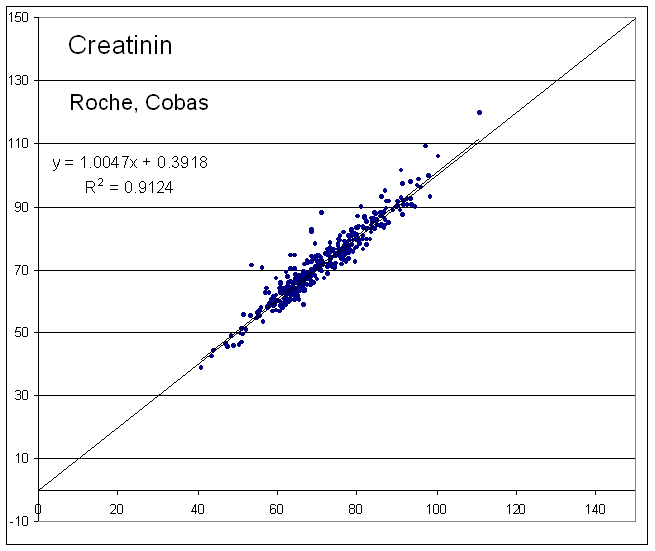
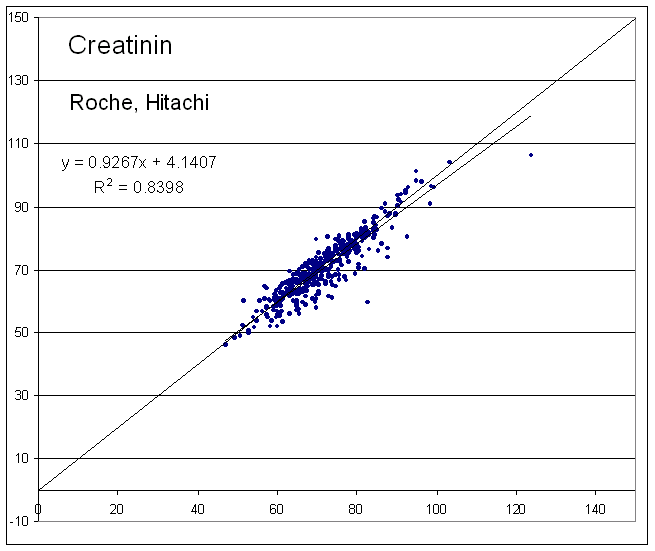
Comparisons thawed serum (x)/fresh plasma (y) (regression plot) stpf
Only data for calculating reference intervals used.
Regression model: Passing and Babloc
Software: Analyse-It
Comments: None
Comparisons fresh serum/thawed serum (regression plot) stsf
Only data for calculating reference intervals used .
Regression model: Passing and Babloc
Software: Analyse-It

Comments:
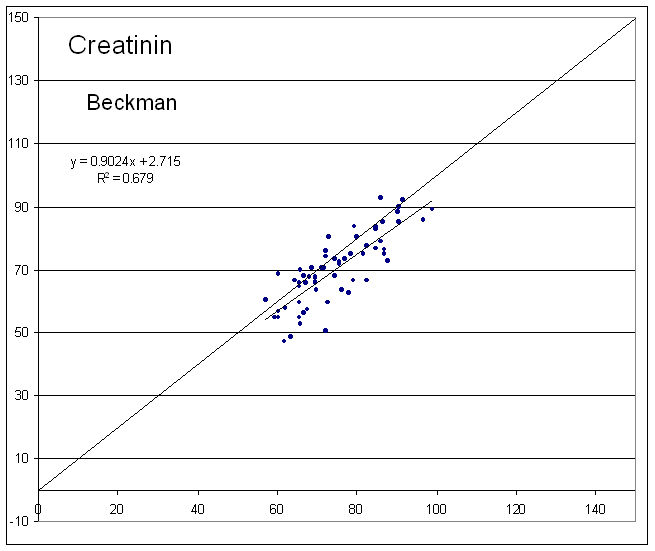
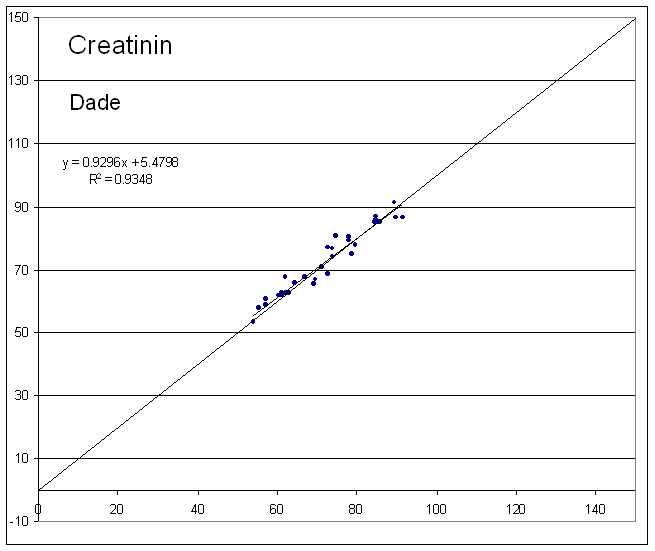
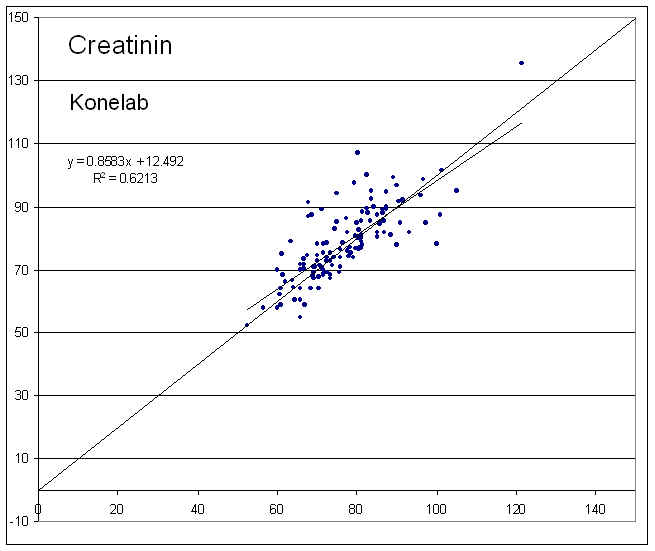
Instrument comparisons thawed serum (x)/fresh plasma (y) korr_sp
Comments: None